check_d Endpoint Scan v3 for Celestia: better monitoring, smarter failover
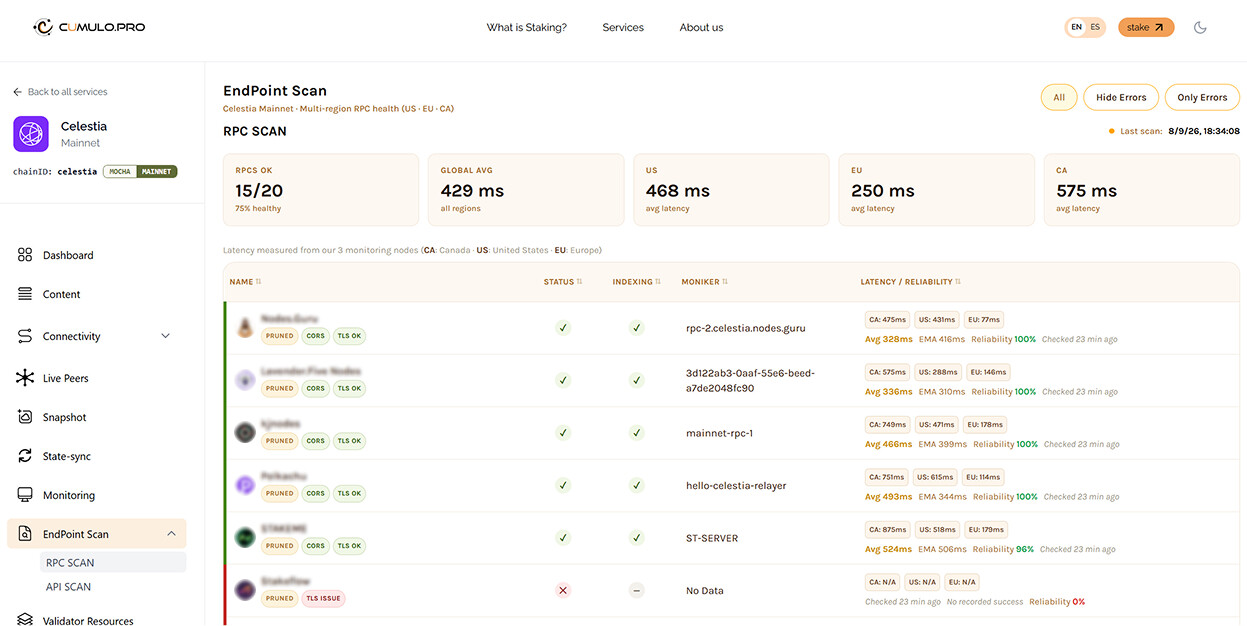
We’ve released v3 of Cumulo’s check_d Endpoint Scan for both Celestia mainnet and Mocha testnet.
This update significantly expands the amount of operational information exposed for each public validator endpoint and introduces a new API layer for automatically selecting the best available RPC or REST endpoint.
What is check_d?
check_d continuously tests public validator RPC and REST/API endpoints from multiple independent geographic locations.
Current probe regions: United States, Europe, Canada
Instead of relying on ICMP pings or synthetic availability checks, check_d performs real protocol requests and tracks:
-
actual response latency
-
block height
-
endpoint availability
-
historical reliability
The goal is to provide a practical view of how endpoints perform from the perspective of real users and applications.
Who is it useful for?
The tool is mainly intended for:
-
Validators comparing the availability and quality of their public infrastructure against the rest of the network.
-
dApp and indexer developers looking for the best-performing endpoints by region.
-
Wallets and infrastructure tools that need automatic failover without hardcoding a single RPC or REST endpoint.
Live scans
Celestia mainnet
RPC:
https://cumulo.pro/services/celestia/rpcscan.php
REST/API:
https://cumulo.pro/services/celestia/apiscan.php
Mocha testnet
RPC:
https://cumulo.pro/services/celestia_mocha/rpcscan.php
REST/API:
https://cumulo.pro/services/celestia_mocha/apiscan.php
What’s new in v3
1. More complete endpoint status
The scanner now exposes substantially more context than a simple up/down status.
Each endpoint includes:
-
Last check. The exact time that specific endpoint was last tested.
-
Last success. For currently failing endpoints, this shows when the endpoint last responded successfully, making it easier to distinguish transient failures from prolonged downtime.
-
Pruned vs Archival. Curated from our validator resources rather than inferred technically from the endpoint.
-
CORS support. Whether the endpoint returns the headers required for direct browser access, particularly useful for wallets and dApps.
-
TLS certificate status. Valid, expiring soon (less than 14 days), or broken. TLS is checked independently every hour so certificate issues remain visible even if the endpoint is unavailable for another reason.
-
Rate-limit hints. If the server exposes
X-RateLimit-*orRetry-Afterheaders, check_d displays them. This detection is entirely passive; no additional requests are generated to trigger rate limiting.
2. Smoothed latency to reduce flapping
In addition to the raw latency measured during each scan cycle, endpoints now expose an Exponentially Weighted Moving Average (EMA).
Raw latency can spike because of temporary network noise or a single slow request. The EMA provides a more stable representation of sustained endpoint performance.
This makes it a safer metric for automated endpoint selection.
3. Smart Endpoint Selector
This is the largest addition in v3.
We now expose a JSON API that applications can use to dynamically select the best available Celestia endpoint instead of hardcoding one.
RPC
Best current endpoint:
GET https://aggregate-rpcs.cumulo.com.es/best-rpc?chain=Celestia+mainnet
Full ranked list:
GET https://aggregate-rpcs.cumulo.com.es/rank-rpcs?chain=Celestia+mainnet
/best-rpc returns a single JSON object containing the current best candidate.
/rank-rpcs returns the full list of eligible endpoints, ordered by rank.
The same pattern is available for REST/API endpoints through:
aggregate-apis.cumulo.com.es
using:
-
/best-api -
/rank-apis
Ranking logic
Only endpoints that are currently healthy are eligible.
Candidates are ranked by:
-
historical reliability over the previous 7 days
-
smoothed latency (EMA) as the tiebreaker
You can also request regional ranking:
®ion=US
®ion=EU
®ion=CA
When a region is specified, the ranking uses latency measured from that specific region instead of the global average.
This can be useful when an application knows where most of its users or backend infrastructure are located.
We are also using the selector internally as an automatic fallback source for some of our own Celestia tools in case our primary endpoints become unavailable.
4. Redesigned monitoring panel
The frontend has also been reorganized so that the new operational data is visible directly from the main table.
Changes include:
-
compact endpoint capability/status badges under each validator
-
combined Latency / Reliability information
-
clearer visibility of endpoint health
-
the current Smart Endpoint Selector winner highlighted directly in the table with a
 badge
badge
This makes it possible to identify the current top-ranked endpoint without having to cross-reference the JSON API.
Documentation
The implementation and documentation are available here:
https://github.com/Cumulo-pro/Cumulo-Front-Chain/tree/main/check_End-Points
As with the rest of our Celestia tooling, the objective is to make validator infrastructure easier to inspect, compare and consume programmatically.
If you notice incorrect information for a particular endpoint, or there are additional metrics that would be useful for validators or builders, feel free to reply in this thread and we’ll take a look.
Cumulo