Introducing Fibre Network API: Open, Verifiable Data on Celestia Fibre

Network monitoring, validator performance, blob retention checks and historical data through a public API powering dashboards, reports and integrations.

Hi Celestia community! :waving_hand:

At Cumulo, we’ve developed Fibre Network API, an open monitoring and data platform that provides an independently verifiable view of how Celestia Fibre is operating on mocha-5.
Fibre introduces new responsibilities for validators beyond signing blocks: maintaining reachable Fibre servers, signing payment promises, serving publishers and retaining committed data.

These responsibilities directly affect the network’s ability to operate. Fibre payments require signatures representing at least 2/3 of bonded stake, making collective validator readiness just as important as individual uptime.

Fibre Network API makes these conditions measurable, accessible and independently verifiable.

The system continuously combines network measurements, on-chain information and verification of stored data against each blob’s commitment, making the results available through a public API.

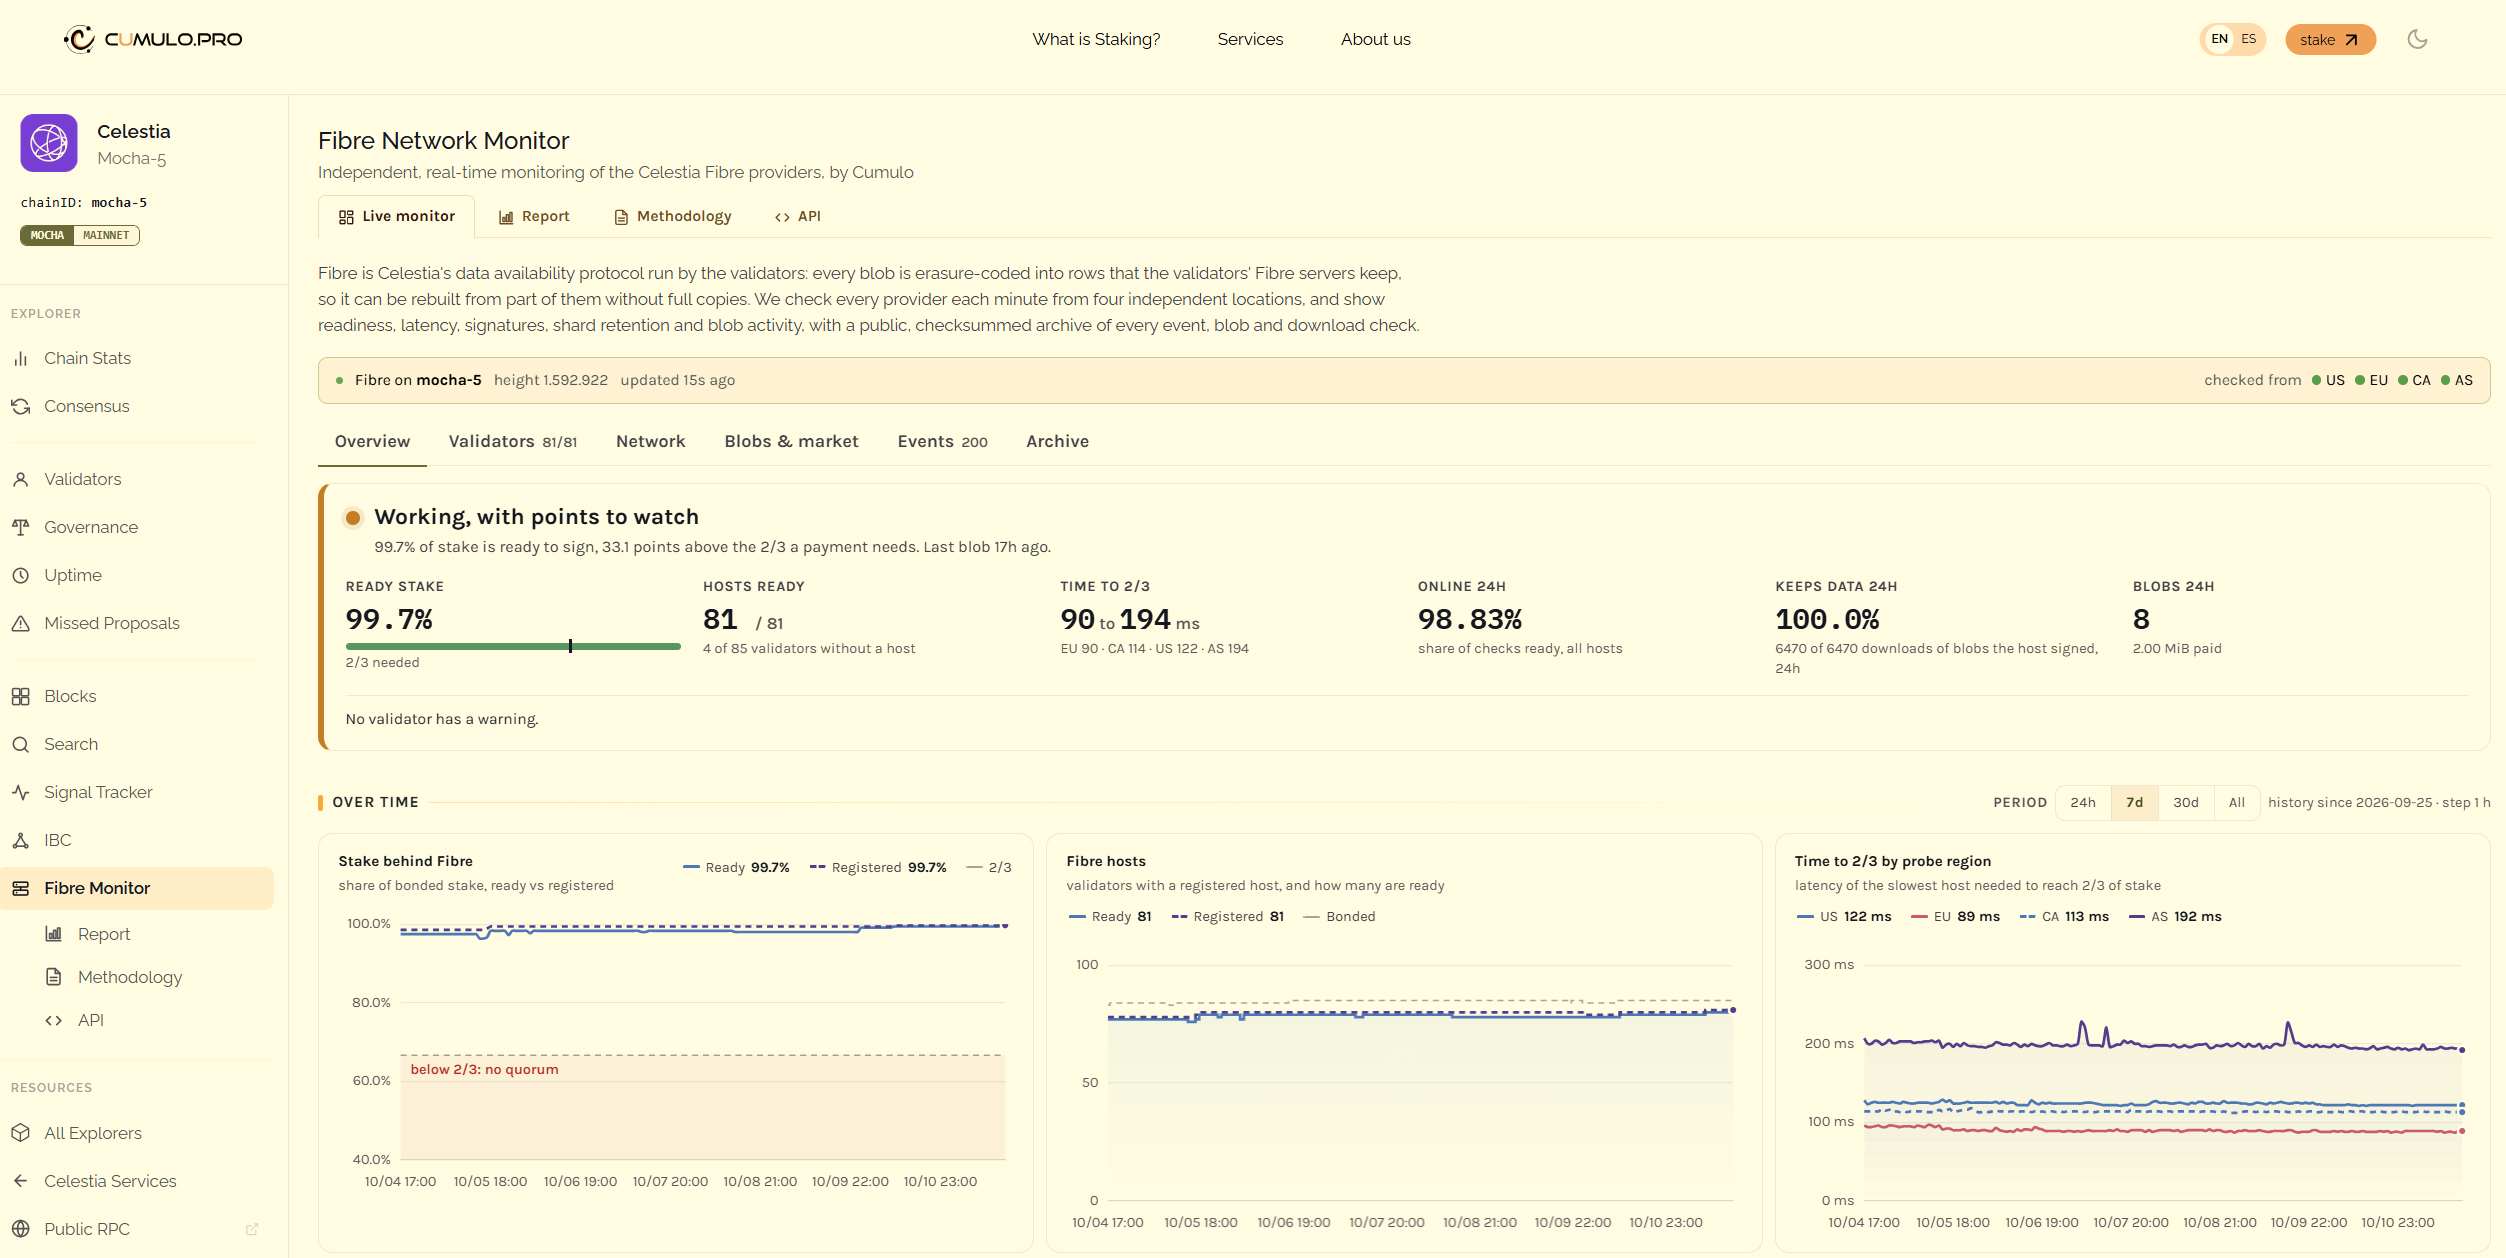
That same data powers an interactive dashboard, periodic reports, a Telegram bot and external monitoring integrations.

:link: Explore Fibre Network API


1. What does Fibre Network API measure?

The platform goes beyond conventional endpoint monitoring to analyse Fibre’s actual operational performance.

Network readiness and settlement conditions

Tracks operationally ready bonded stake against the 2/3 threshold, including regional differences and the time required to reach sufficient voting power.

Validator performance and identity

Checks Fibre server availability, HTTP/2 connectivity, expected validator identity, certificates, latency and historical performance.

Signatures and voting power

Decodes signatures from on-chain payments using the validator set at the promise height. It distinguishes between validators that signed, those whose signatures were not collected because the threshold was already reached, and providers that were not ready.

Verified blob retention

Downloads data from validators during the retention window and verifies that the retrieved rows match each blob’s commitment. This measures whether providers actually retain and serve the data they signed for, rather than assuming they do.

Infrastructure concentration

Analyses how many validators, hosting companies or countries would need to become unavailable before Fibre could no longer meet the 2/3 threshold.

Fibre activity and economics

Tracks published blobs, data volumes, publishers, namespaces, fees paid in TIA, escrow activity and payment records.

Together, these measurements provide a network-wide perspective of Fibre’s reliability, participation and usage.


2. Public API: open data for validators and developers

The core of the platform is a public, read-only API, designed to make Fibre monitoring data accessible and reusable.
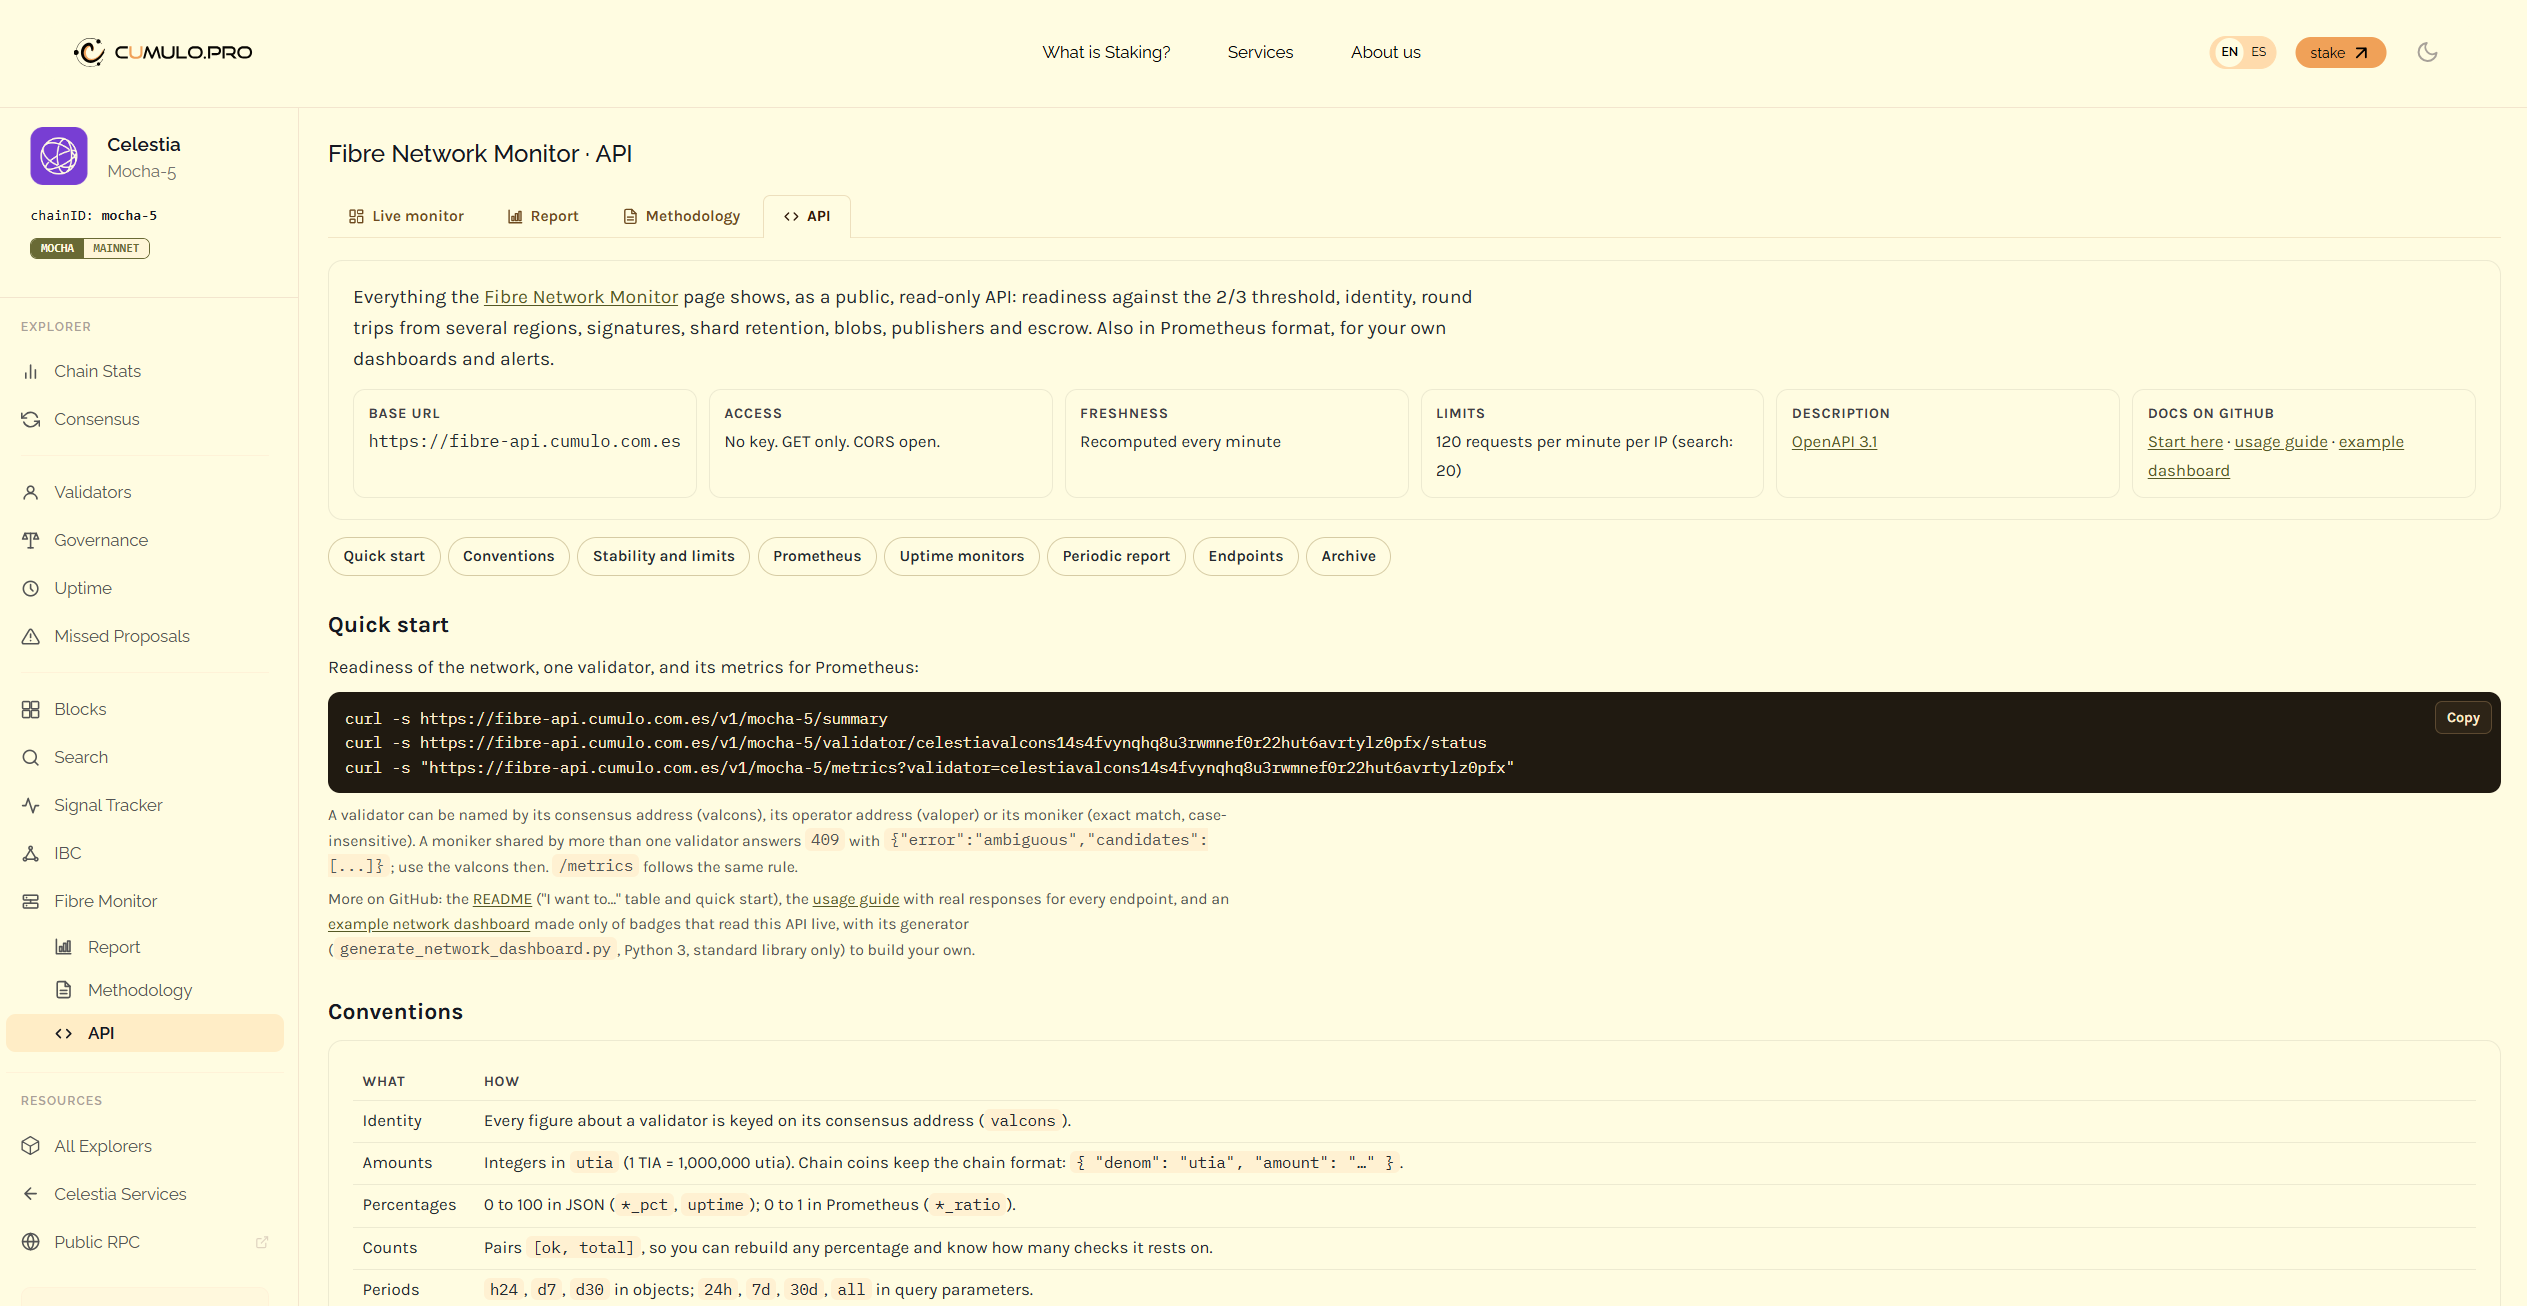
It requires no API key, supports CORS, is updated every minute and is documented using OpenAPI 3.1.

The API exposes:

  • Network status, readiness and historical time series.

  • Individual validator performance, signatures and retention checks.

  • Blob activity, publishers, namespaces and economic data.

  • Infrastructure concentration and operational events.

  • Periodic reports and historical archive records.

It also provides Prometheus metrics, live SVG badges and validator status endpoints compatible with external monitoring systems such as Grafana, Uptime Kuma and UptimeRobot.

For example, retrieve the network summary directly:

curl -s https://fibre-api.cumulo.com.es/v1/mocha-5/summary

Developers can use these endpoints to build their own dashboards, monitoring systems, alerts or analytical tools without maintaining a separate Fibre data collection infrastructure.

:link: API documentation | GitHub quick start


3. One data platform, multiple tools

To make this information useful across different workflows, we’ve built several applications around the monitoring data.

:bar_chart: Interactive Dashboard

A real-time interface for exploring network readiness, validator performance, regional latency, signatures, blob retention, infrastructure concentration and Fibre’s economic activity.

Each validator has its own performance page, including historical metrics and individual blob participation.

:link: Explore the Dashboard

:chart_increasing: Fibre Network Reports

Weekly, monthly and yearly reports covering network availability, validator performance, data volumes, TIA fees, escrow activity and infrastructure changes.
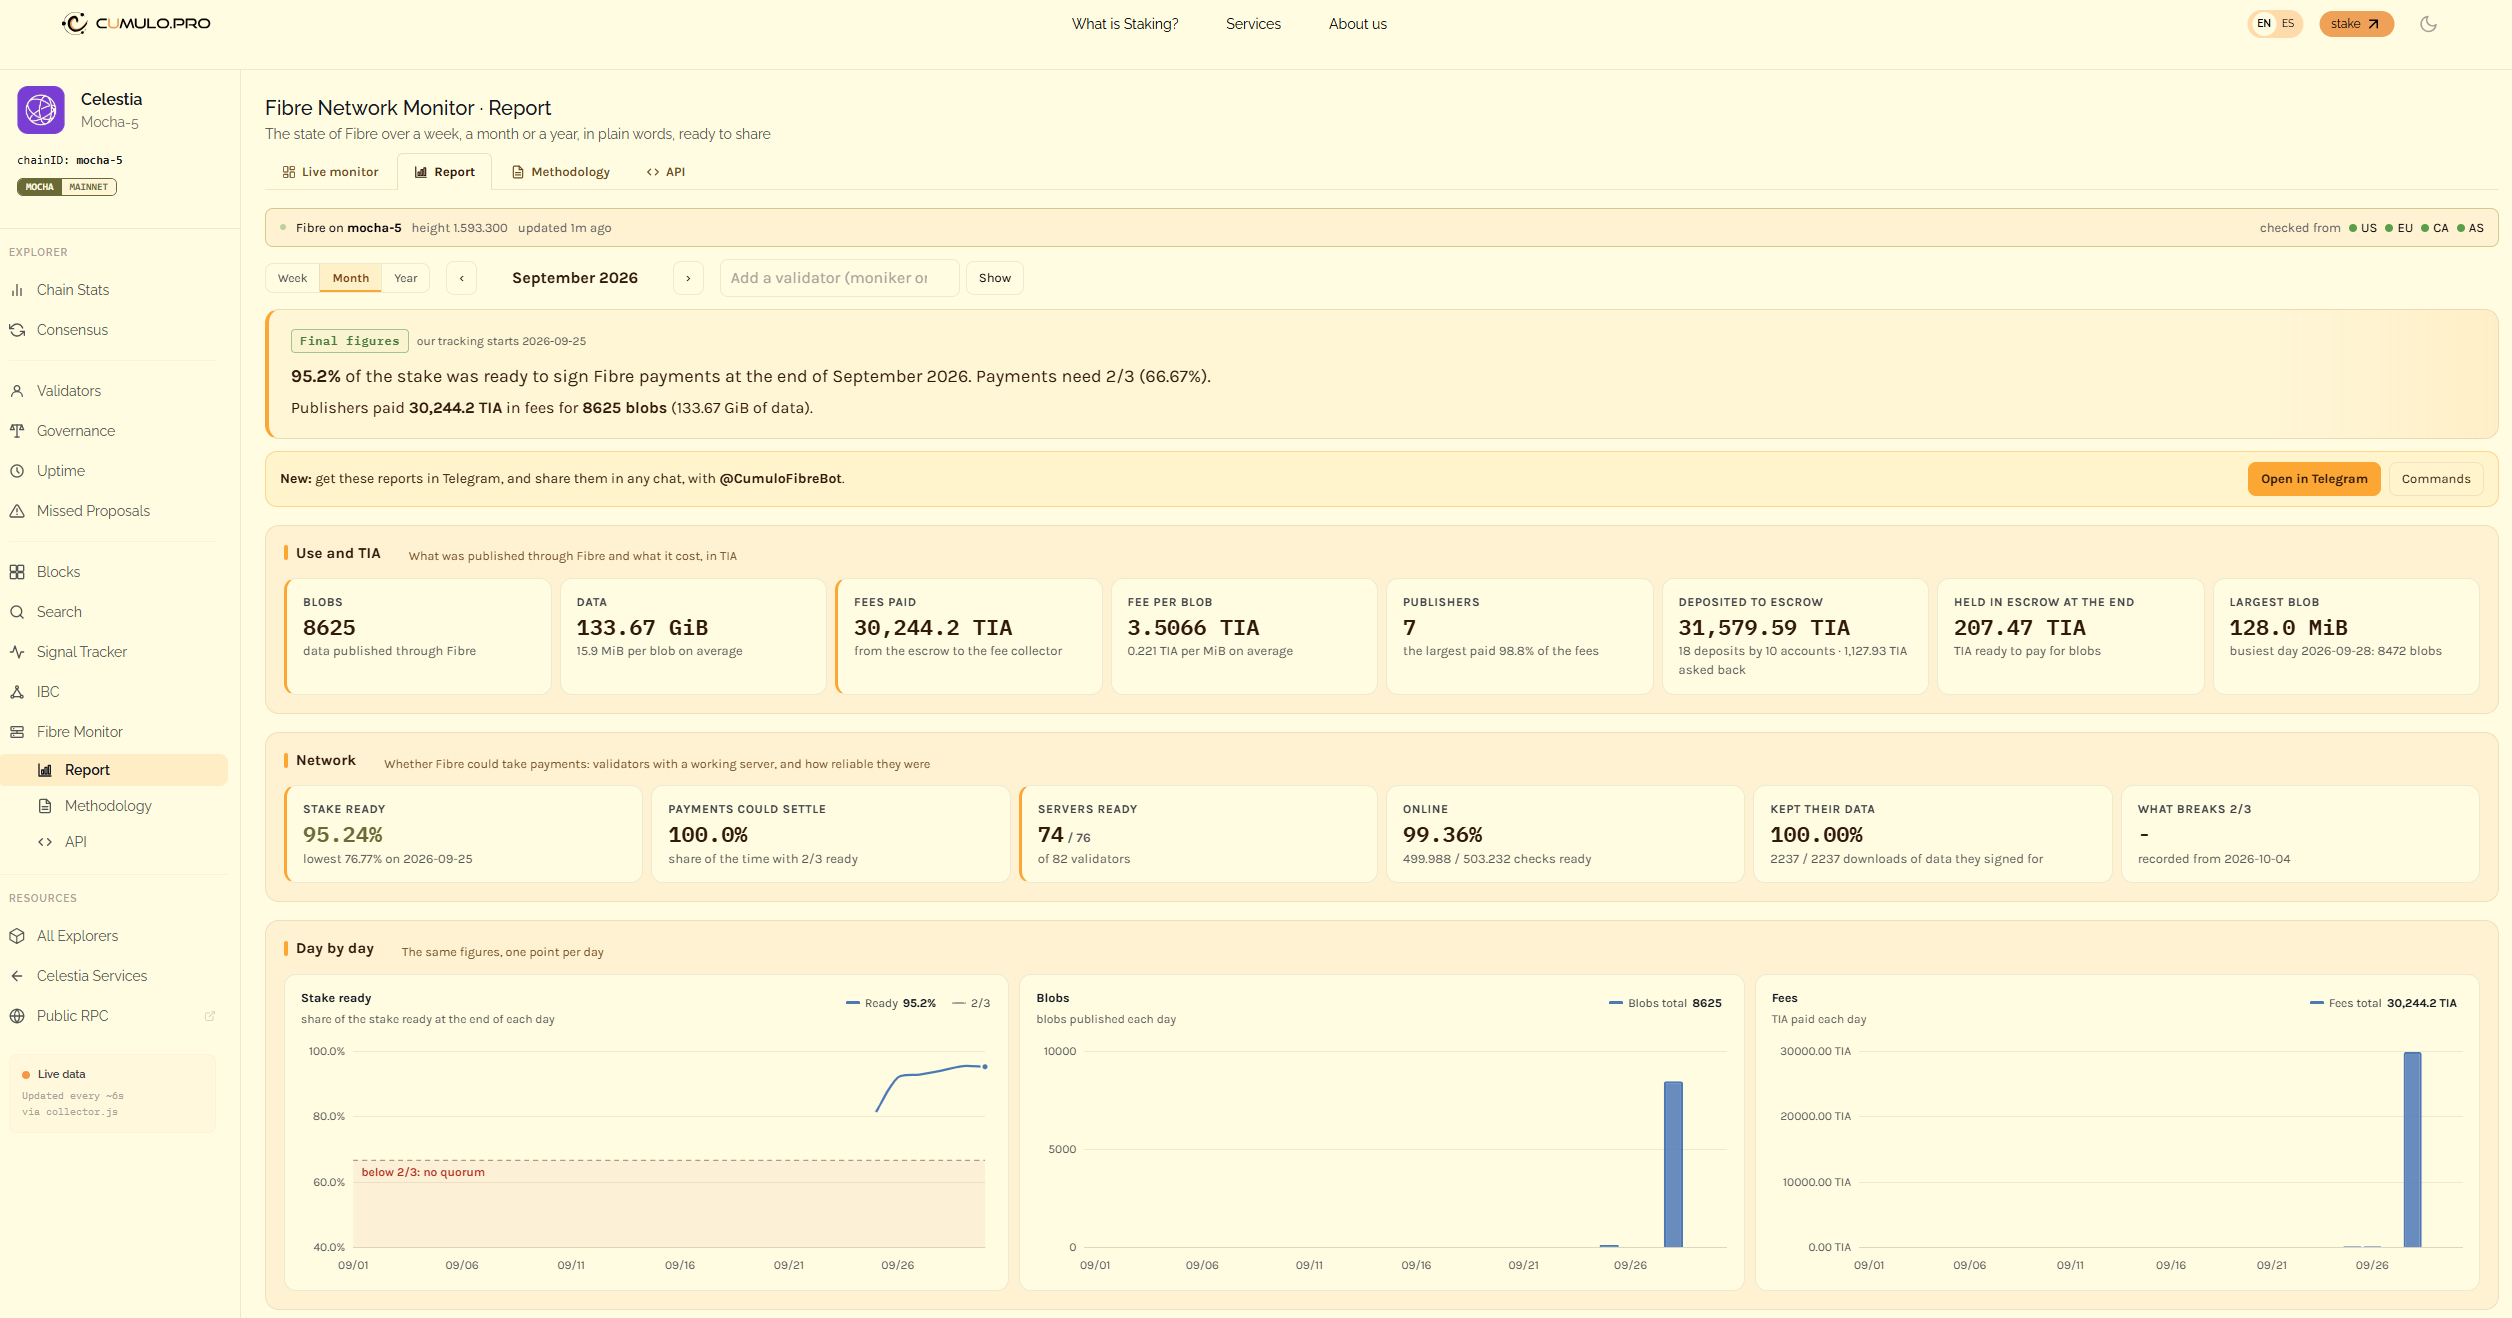
Reports include historical comparisons, permanent links, downloadable images and shareable text summaries.

Validators can also generate reports focused on their own infrastructure.

:link: Explore the Reports

:robot: Telegram Bot

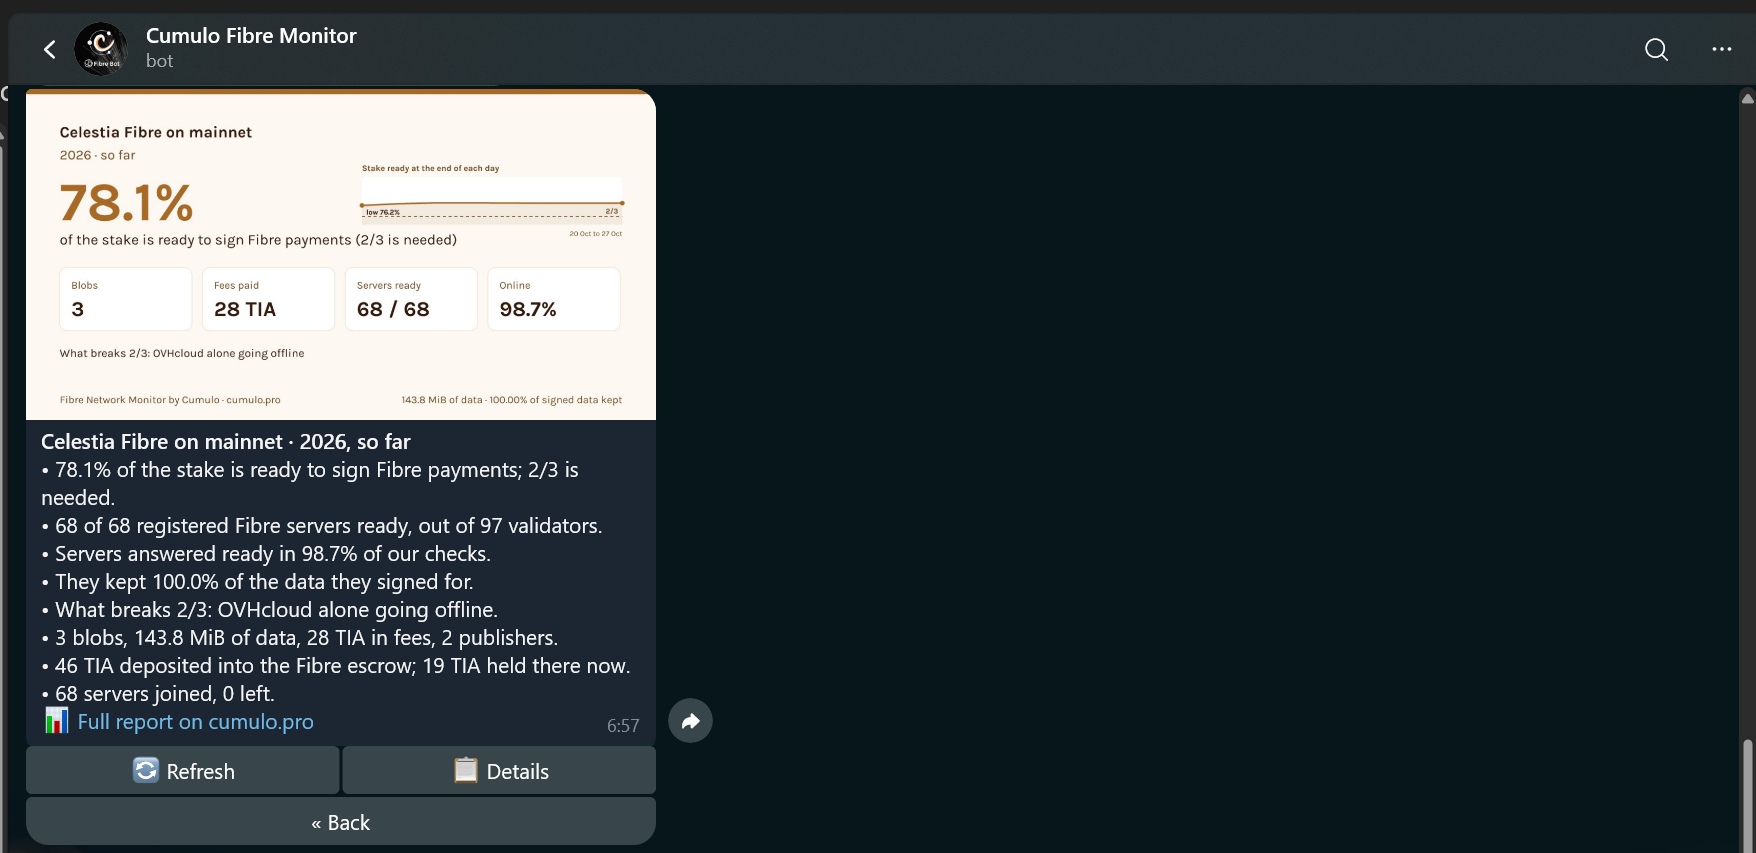
@CumuloFibreBot provides network, validator and market reports directly in Telegram.

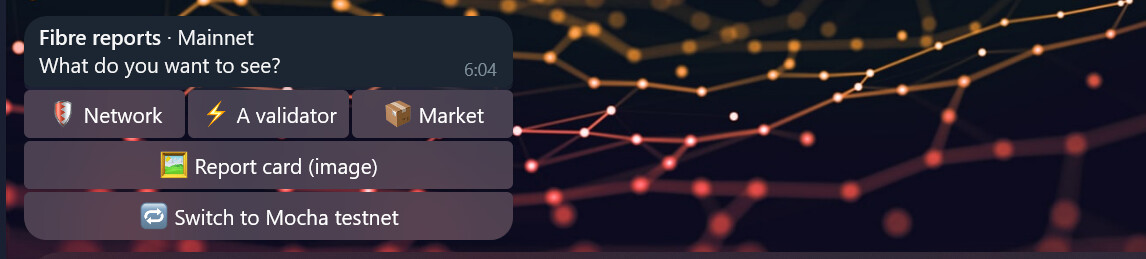
Use /fibre for the report menu, /status <validator> for individual validator information or /card for last week’s report card.
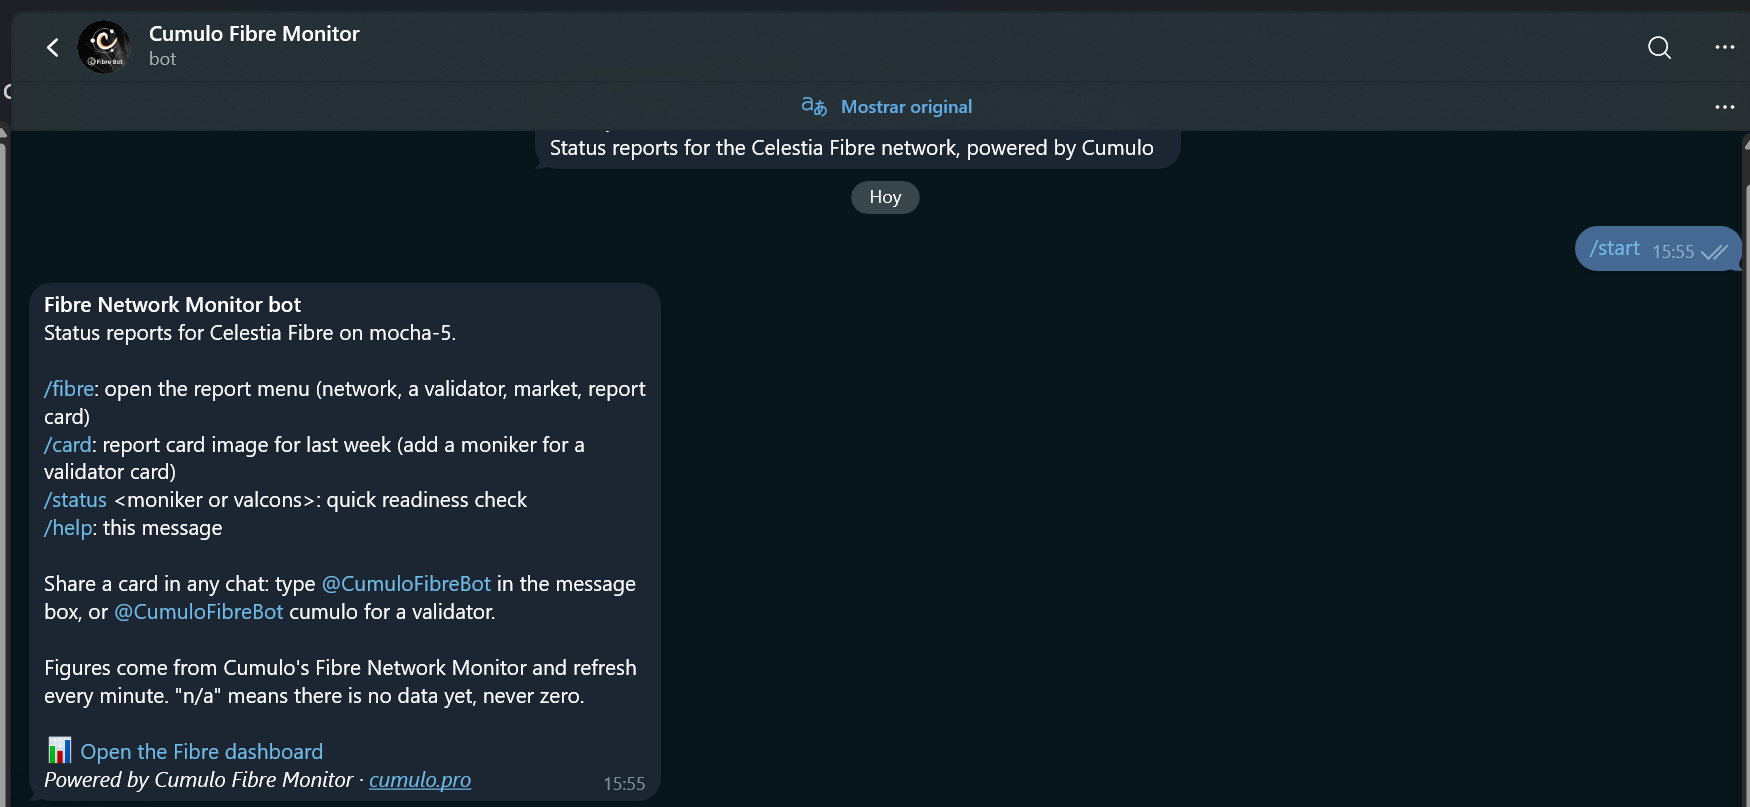
The bot also supports inline report sharing in Telegram conversations.

:puzzle_piece: External integrations

The public API allows other developers and operators to reuse the same data.

We’ve published an example dashboard built entirely with live API-powered badges, together with a Python generator.


4. Verifiable data, not just reported metrics

One of the main principles behind Fibre Network API is that users should be able to verify the information independently.

The platform maintains a public historical archive containing network events, blob records, signer bitmaps, validator sets, voting power and data retention checks.

Records are published as daily JSON Lines files.

Once a day is closed, its archive is compressed and never modified. SHA-256 checksums are published in a manifest, while corrections are recorded separately to preserve the original history.

Completed months are available as reproducible downloads.

We also publish a consistency test that reconstructs signatures, retention results, charges and voting power from the public records, checking them against the API outputs.

How is the data collected?

Independent monitoring probes operate every minute from four locations across North America, Europe and Asia.

They measure connectivity, identity, regional latency, readiness and data retrieval performance.

A validator is classified as ready only when a majority of monitoring regions agree, reducing false positives caused by isolated network failures.

These observations are combined with on-chain information and verification of downloaded rows against the corresponding blob commitments.
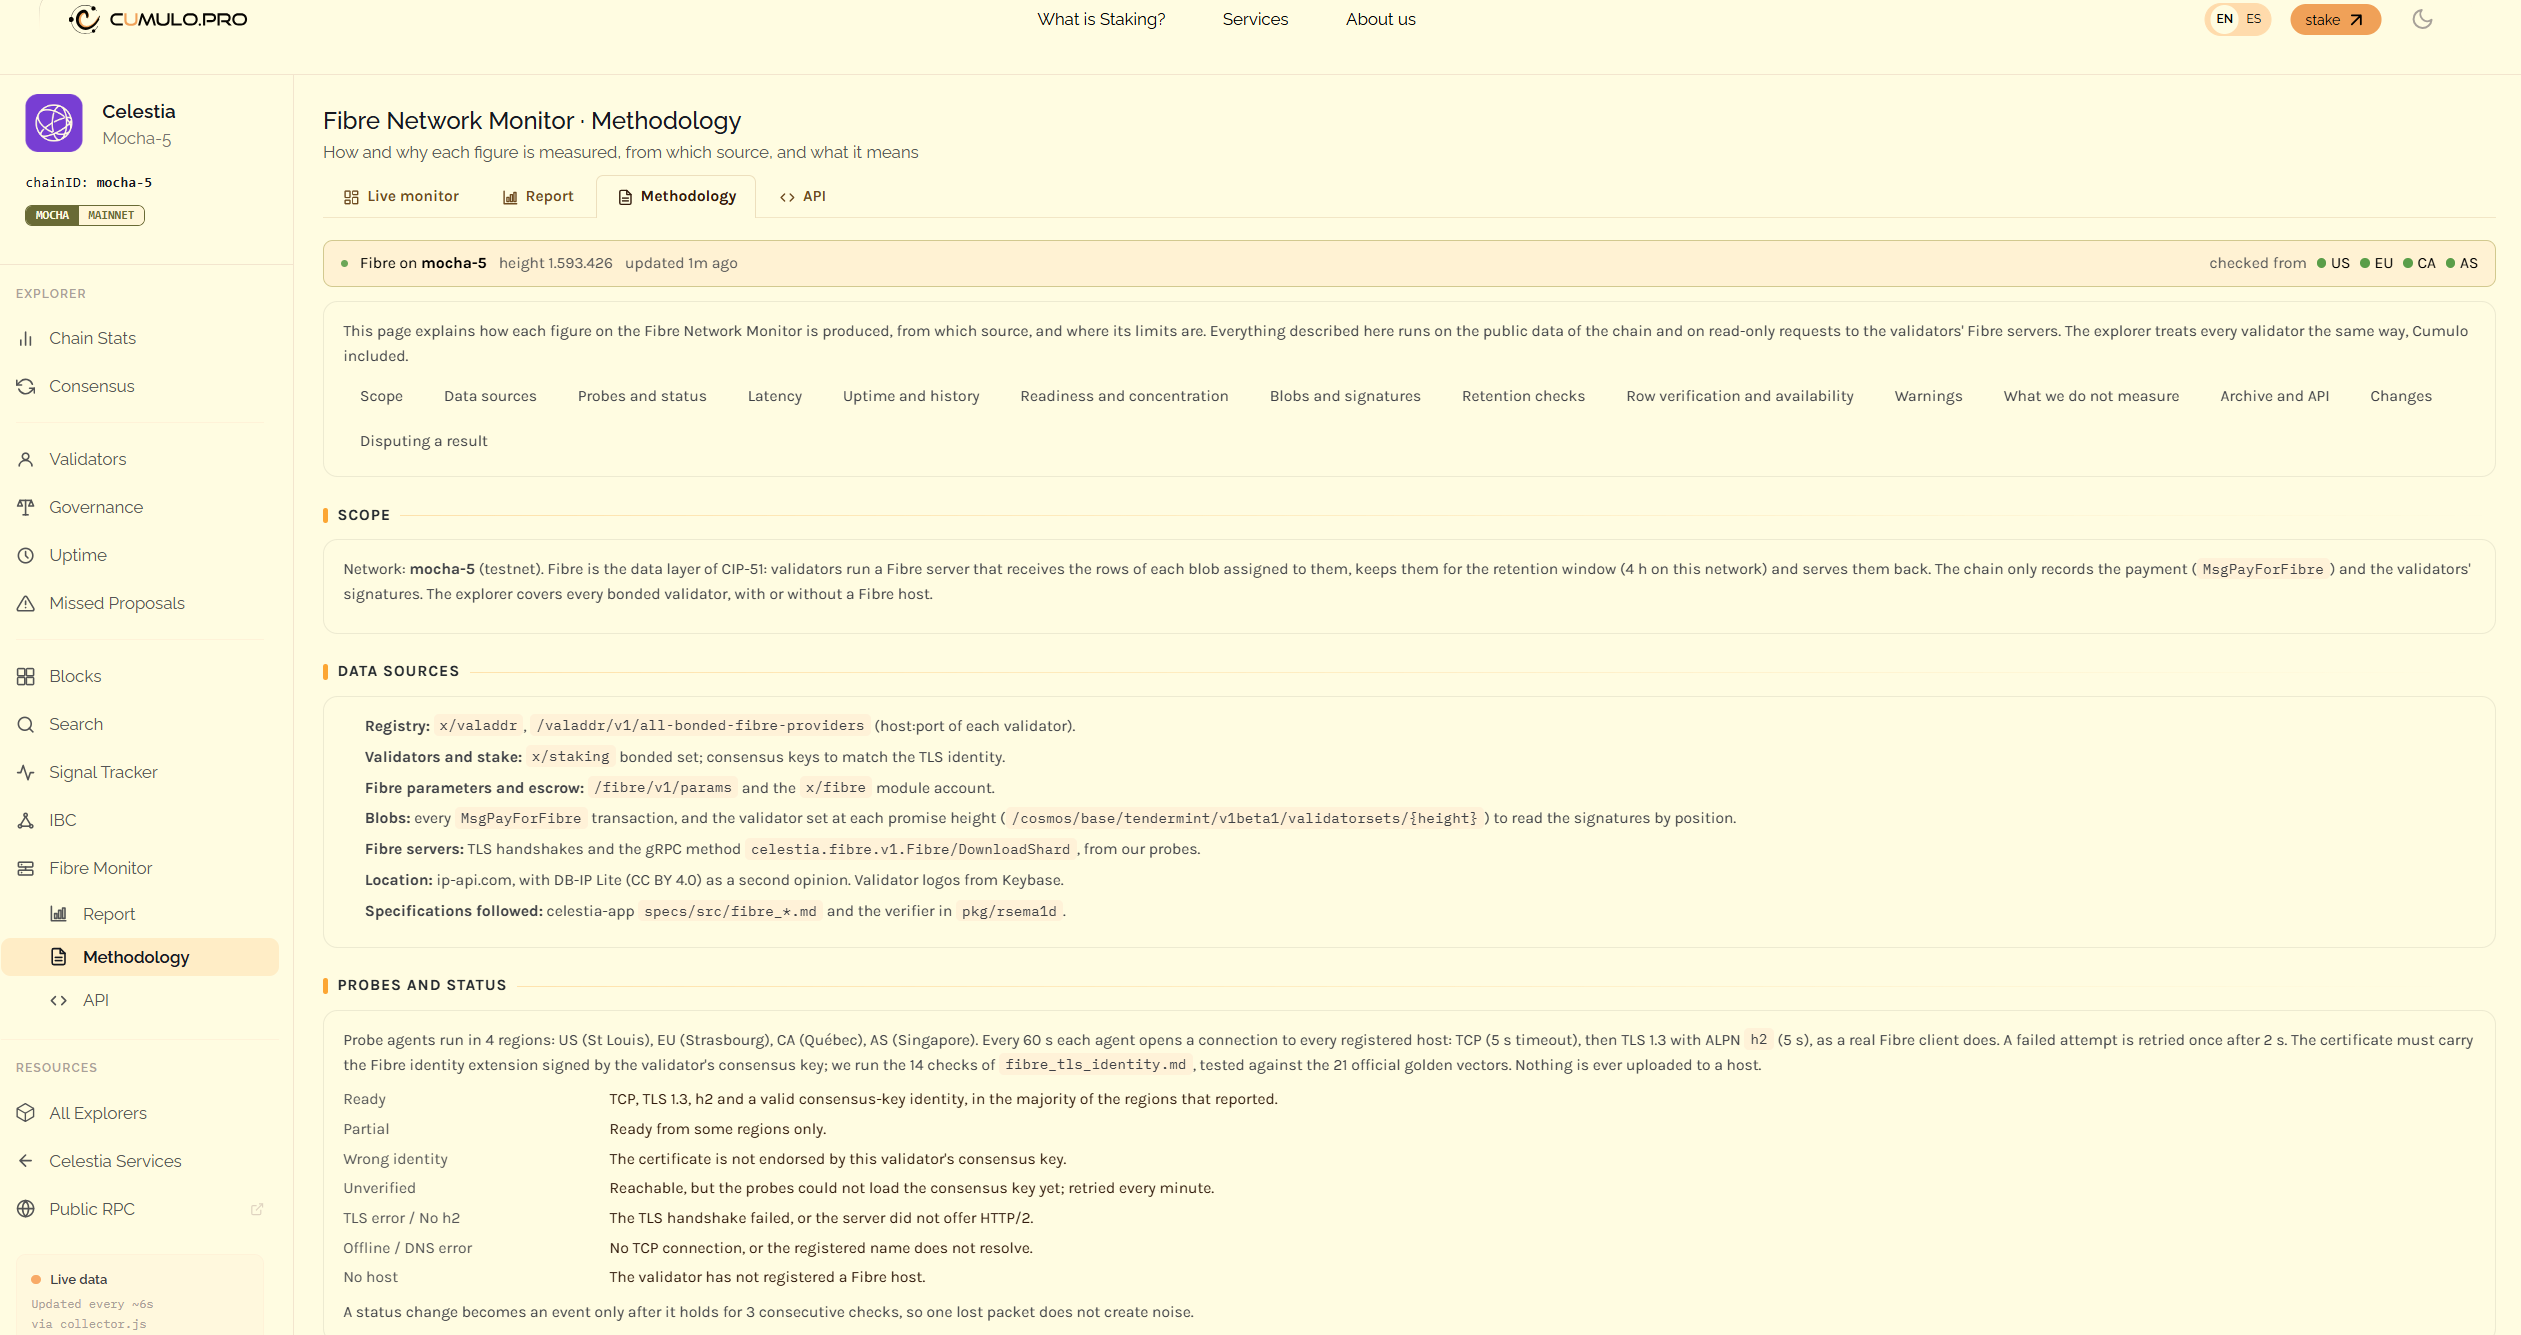
Our methodology explains the sources, calculations and interpretation of each metric.

:link: Read the Methodology


5. Why we built it

Fibre’s reliability depends on more than individual validator uptime.

The network must have sufficient ready stake, validators must fulfill their data retention commitments, and infrastructure must remain resilient to failures.

We believe these conditions should be visible not only to validators, but also to publishers, developers and the wider Celestia community.

Our goal is to provide a source of open operational data that anyone can access, integrate into their own tools and independently verify.

Fibre Network API currently operates on mocha-5 and is designed to extend to mainnet.

As a Celestia validator and infrastructure provider, Cumulo is committed to supporting the network through reliable operations, continuous monitoring and publicly accessible infrastructure tools.


Explore, integrate and share your feedback

All resources are publicly available:

We’d love to hear from the Celestia community.

If you’re operating Fibre infrastructure on mocha-5, explore your validator’s metrics and test the API.

Which metrics, integrations or additional capabilities would be most valuable to you?

Feedback, technical suggestions and corrections are welcome in this thread.

Making Fibre observable is useful. Making its data open and independently verifiable is what allows the entire ecosystem to build on it.

Cumulo
Celestia Validator & Infrastructure Provider
https://cumulo.pro

1 Like

Nice work making this data public. A question from the delegator side: once Fibre reaches mainnet, will a validator’s Fibre readiness also show on the regular validator pages in your explorer? For people choosing where to stake TIA, seeing it next to uptime and missed proposals, with a short note on what it means for them, could be really helpful.

1 Like

Hi @Anzus_GemWallet, thank you, as always, for such constructive feedback; it really helps us improve.

You’re right: for someone choosing where to stake TIA, a validator’s Fibre readiness should sit right next to uptime and missed proposals. We’ve taken note and will add it to the validator pages of our explorer, first on testnet and then on mainnet, which is just around the corner, with a short plain-language note on what it means for delegators.

Thanks again, and keep the ideas coming! :saluting_face:

1 Like

Super excited to see where this leads.

1 Like

Introducing CumuloFibreBot: Celestia Fibre monitoring on Telegram, powered by our open API

Hi everyone!

CumuloFibreBot is our free Telegram bot that makes it easier to monitor Fibre network activity, validator performance, and blob market metrics across both mainnet and Mocha testnet.

The goal is simple: make Fibre operational data more accessible to validators, developers, and the wider Celestia community, while demonstrating what can be built using our public Fibre Network Monitor API.

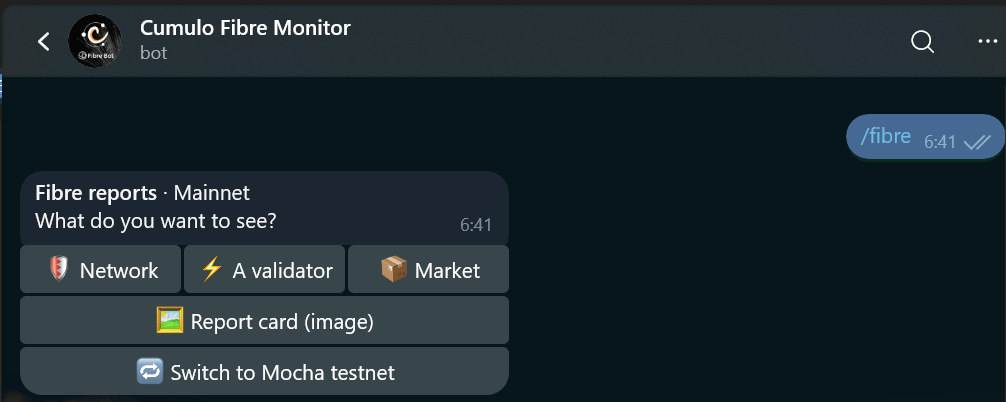
:backhand_index_pointing_right: Try it: Telegram: Launch @CumuloFibreBot send /fibre to get started.

Built on our Fibre Network Monitor API

The bot is powered by Cumulo’s public Fibre Network Monitor API:

https://fibre-api.cumulo.com.es

This is the same data source behind our Fibre monitoring dashboards:

Our monitoring infrastructure probes registered Fibre servers from multiple geographic regions, tracking availability, signing activity, data retention, and blob market metrics.

The Telegram bot makes this information available through short, readable reports without requiring users to navigate dashboards or query API endpoints.

Importantly, the bot does not substitute missing data with estimates. When a metric is unavailable, it displays n/a rather than reporting a misleading zero.

What can you monitor?

Send /fibre to access three report categories and a shareable report card.

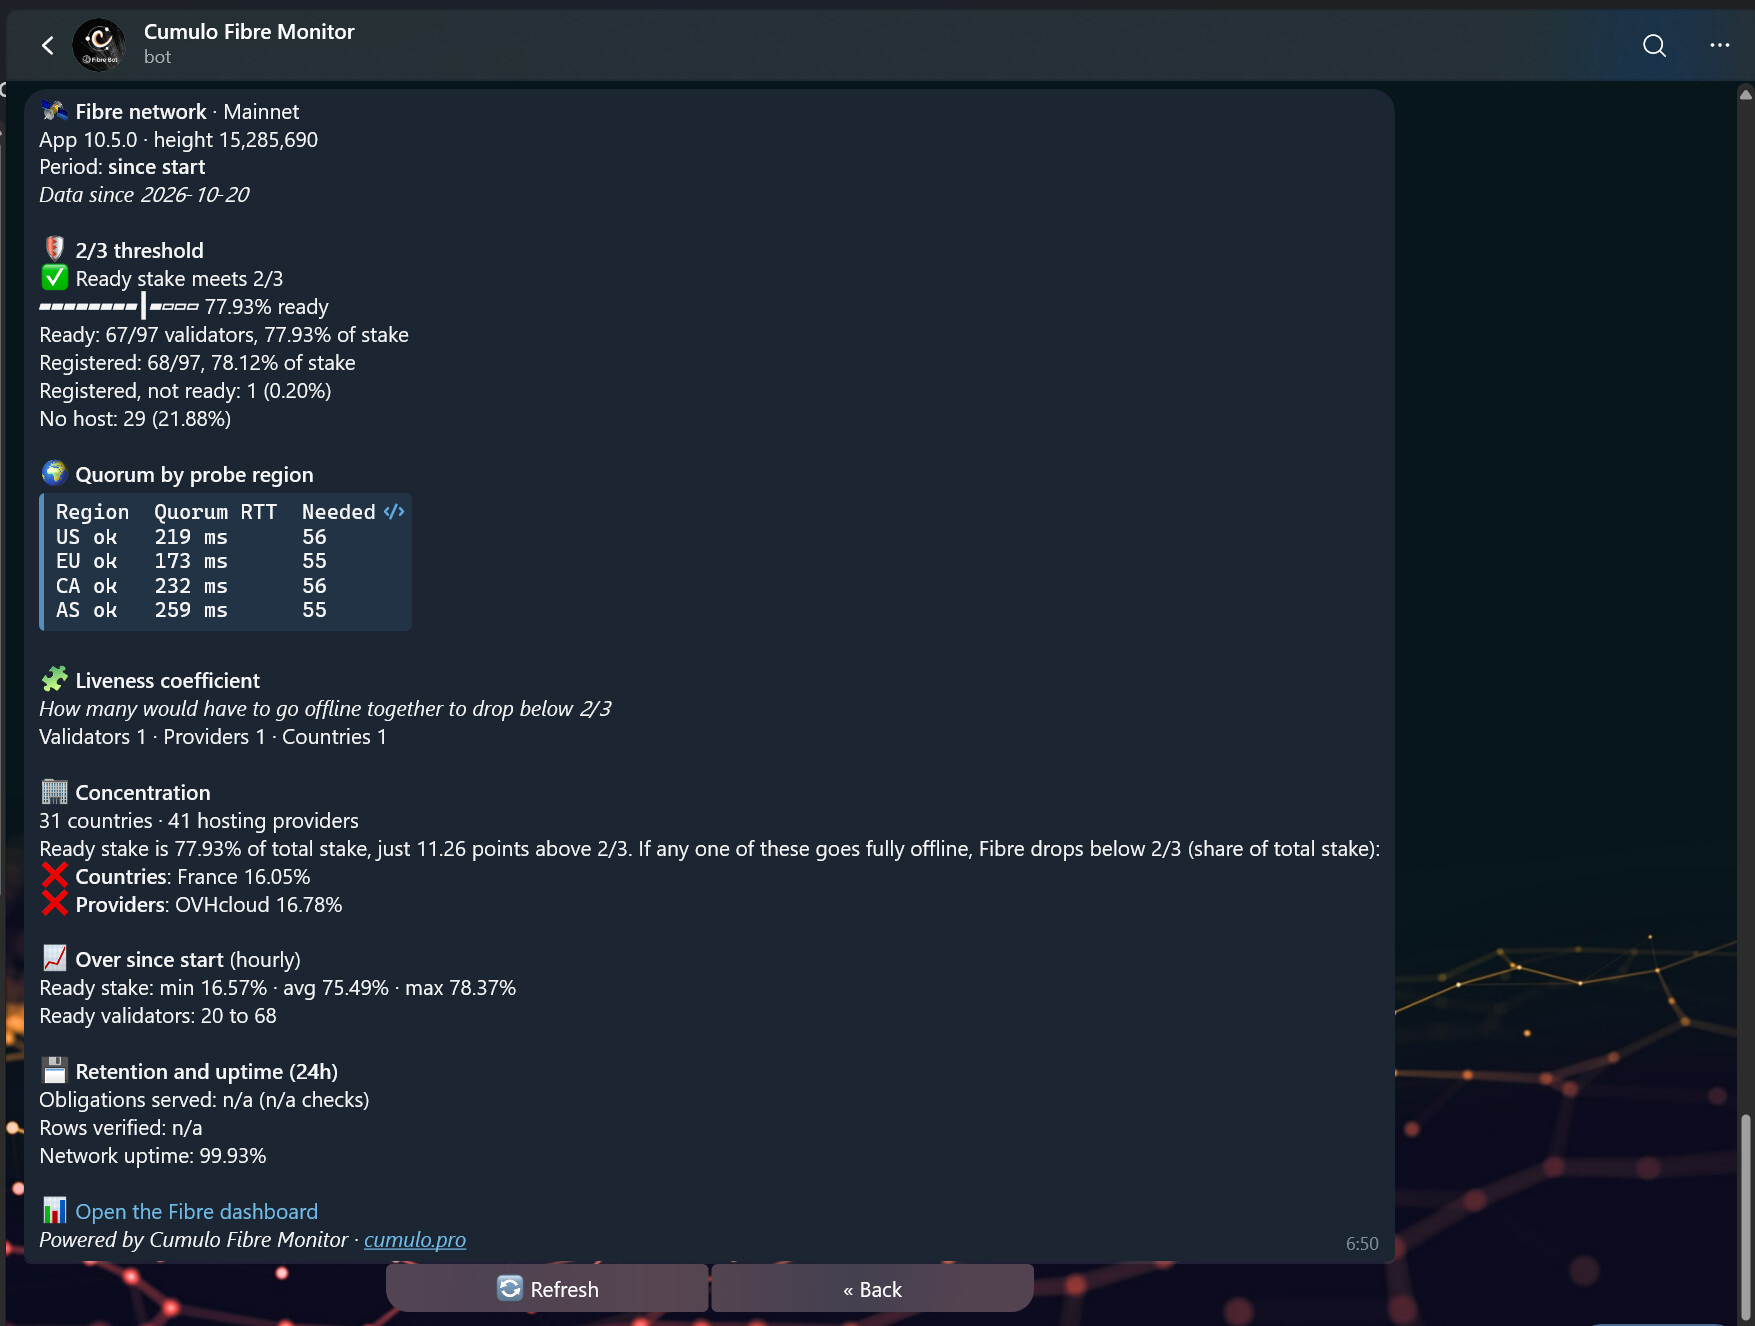
1. Network health and resilience

Monitor Fibre’s overall operational status, including:

  • Settlement readiness: Whether ready stake exceeds the 2/3 threshold, with a visual stake distribution bar.

  • Validator participation: Ready, registered, and hostless validators.

  • Regional performance: Quorum latency measured from US, EU, CA, and AS.

  • Liveness coefficient: How many validators, hosting providers, or countries would need to become unavailable simultaneously to bring ready stake below 2/3.

  • Infrastructure concentration: Whether the failure of a single country or hosting provider could break the 2/3 threshold.

  • Data retention and uptime: Network-wide availability and retention metrics.

These metrics help operators assess not only whether Fibre is functioning, but also how resilient its infrastructure is to potential failures.

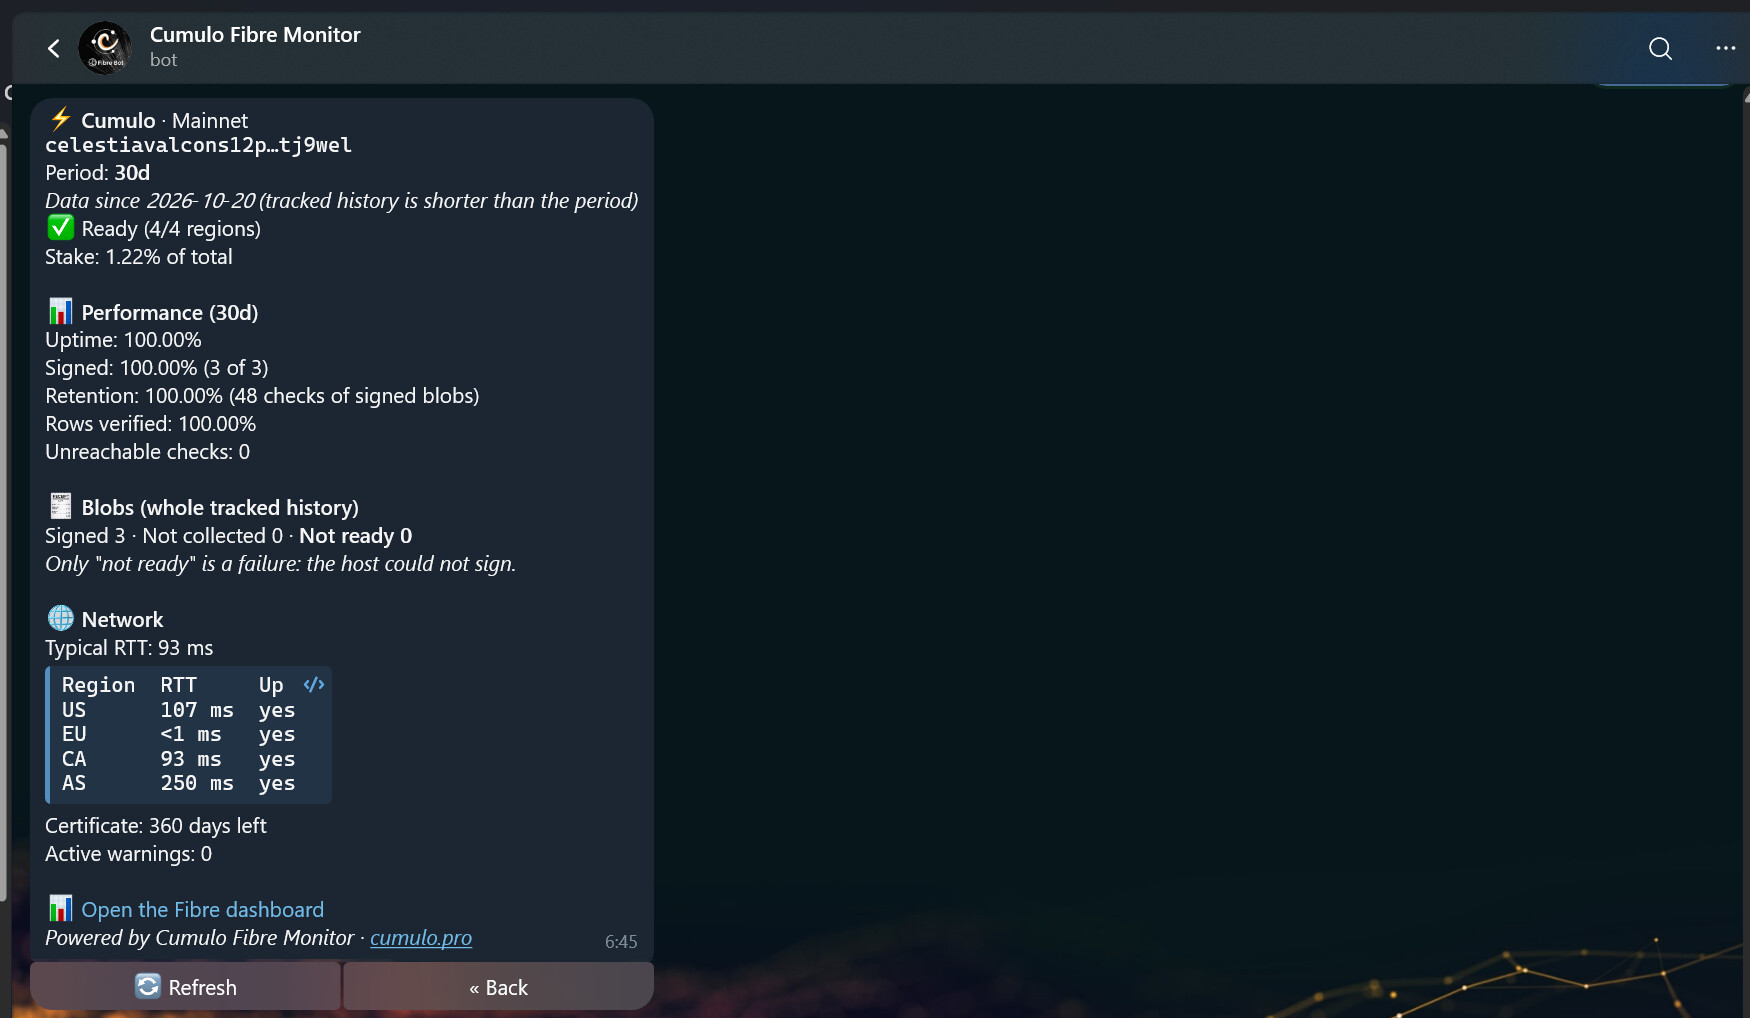
2. Individual validator performance

Search for any validator by moniker or consensus address (valcons) to inspect:

  • Availability across monitoring regions.

  • Stake, uptime, and signed blobs.

  • Retention of signed data and blob outcomes.

  • Round-trip time (RTT) by region.

  • TLS certificate expiration.

  • Active operational warnings.

This gives validators a quick way to check their Fibre server and allows other participants to independently inspect validator performance.

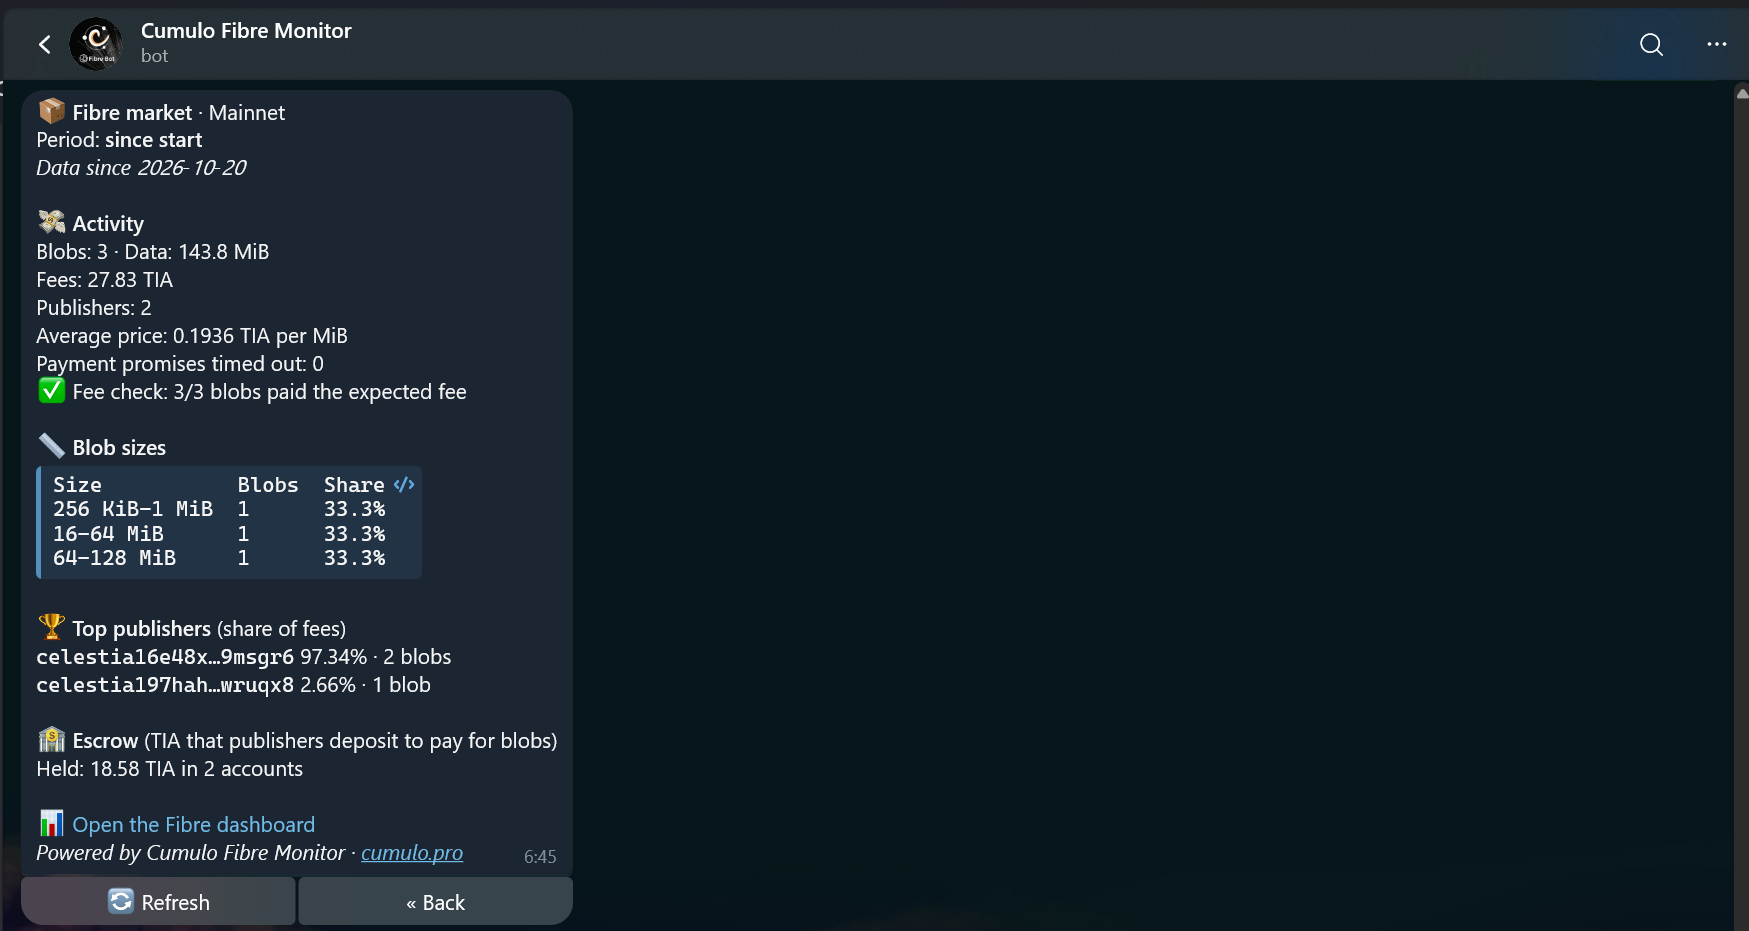
3. Blob market activity

Follow Fibre usage and market activity through:

  • Published blobs and total data volume.

  • Fees and publisher activity.

  • Average price per MiB and fee formula verification.

  • Blob size distribution.

  • Top publishers and escrow balances.

4. Shareable report cards

These cards make it easier to share Fibre metrics in Telegram groups and community discussions.

Available reporting periods:

  • Network and market: 24h, 7d, 30d, or all-time.

  • Validators: 24h, 7d, or 30d.

  • Cards: This week, last week, this month, last month, this year, the entire network or an individual validator.

Quick commands and Telegram integration

You can access the main reports through /fibre, or use a few shortcuts:

  • /status cumulo : One-line availability check for a validator.

  • /card : Generate last week’s network report card. Add a validator moniker for an individual card.

  • /help : Display available commands.

Mainnet and Mocha support

Mainnet is selected by default, but you can switch to Mocha directly from the menu.

Commands also accept an explicit network, for example:

  • /status mocha cumulo

  • /card mainnet

Every response identifies the network being monitored.

Inline sharing

You can also share report cards directly in Telegram conversations.

Type @CumuloFibreBot in any supported chat to select a report card.

  • @CumuloFibreBot cumulo : Validator-specific cards.

  • @CumuloFibreBot mocha : Mocha network cards.

If a group doesn’t support inline bots, you can generate the card privately and forward it.

Privacy and infrastructure efficiency

We designed the bot to be lightweight and straightforward to operate.

  • No registration or user database.

  • A single background process serves all users, preventing API traffic from scaling with the number of bot users.

  • API rate limits are respected.

  • Reports indicate when the underlying data is more than 10 minutes old.

Open source: build your own Fibre monitoring tools

Beyond providing a convenient Telegram interface, one of our main goals is to demonstrate what developers can build using the Fibre Network Monitor API.

The bot is fully open source under the MIT license:

GitHub repository:

The underlying API is publicly accessible, free to use, and requires no API key.

We’ve also included a short developer guide in the bot’s README covering:

  • Which API endpoints to use.

  • Rate limits and recommended usage.

  • How to handle networks where Fibre is not yet active.

  • How to build your own bot, dashboard, or alerting system using the same data.

Full API documentation:

Feel free to fork the repository, reuse components, or build something entirely new.

We’d especially like to see other validators and developers experimenting with this data to create additional monitoring and observability tools for the Celestia ecosystem.

Feedback and contributions

As Fibre adoption grows, having accessible and independently verifiable operational data becomes increasingly valuable.

At Cumulo, we’ll continue developing public monitoring infrastructure and making our operational data available to the community.

If you have suggestions, encounter bugs, or notice metrics that don’t look right, please share them in this thread, open a GitHub issue, or contact us at [email protected].

And if you build something using the API, we’d love to hear about it!

2 Likes

Hi @Anzus_GemWallet, as promised, Fibre readiness is now on the validator pages of our explorer, for both mainnet and Mocha:

  • The validator list has a sortable Fibre column (Ready, Partial, Not ready or No server), so you can compare validators at a glance: Validators · Celestia Explorer · Cumulo
  • Each validator page has a Fibre readiness card next to uptime: Fibre uptime over 7 and 30 days, whether it signs blobs and keeps the data, how many of our four probe regions reach it, any active warnings, and a link to its full Fibre profile.

It also includes a short note for delegators: a ready Fibre server means the validator helps Fibre reach the 2/3 of stake it needs to take payments. Fibre fees go to the chain’s fee pool and are shared with all stakers like other fees, so readiness shows a validator’s contribution to the network rather than a change to your rewards.

Thanks again for the idea! :saluting_face:

1 Like

Thanks, Mon. Great to see this live on both mainnet and Mocha. The delegator note is especially helpful: making it clear that readiness shows a validator’s contribution rather than a change to your rewards answers the first question most stakers would ask. That’s useful on our support side too.

1 Like