Hi everyone,
Following up on our Datacenters post ( Celestia Datacenters in Pulse, provider incidents, and the same data for AI agents through BlobPedia ), which helps pick a server for each node role, we have added a Hardware tab to Pulse. It shows what our Celestia nodes actually use while running, next to Celestia’s official recommendations:
In our Fibre post ( Moving Fibre off the validator host: private VLAN + mTLS (mocha-5) ) we promised to share metrics once they start to mean something. This page is where they live now.

What it covers
- Every role we run: validator, bridge, Fibre and light node, on Mainnet Beta and Mocha.
- CPU, RAM, data size, network and disk I/O for each node, as median and max over 24 hours, 7 days or 30 days.
- The CPU model and city for every node, so each number is tied to real hardware.
- Celestia’s recommendation for each role above the table, with each measurement shown as a share of it.
Per-role tables and charts
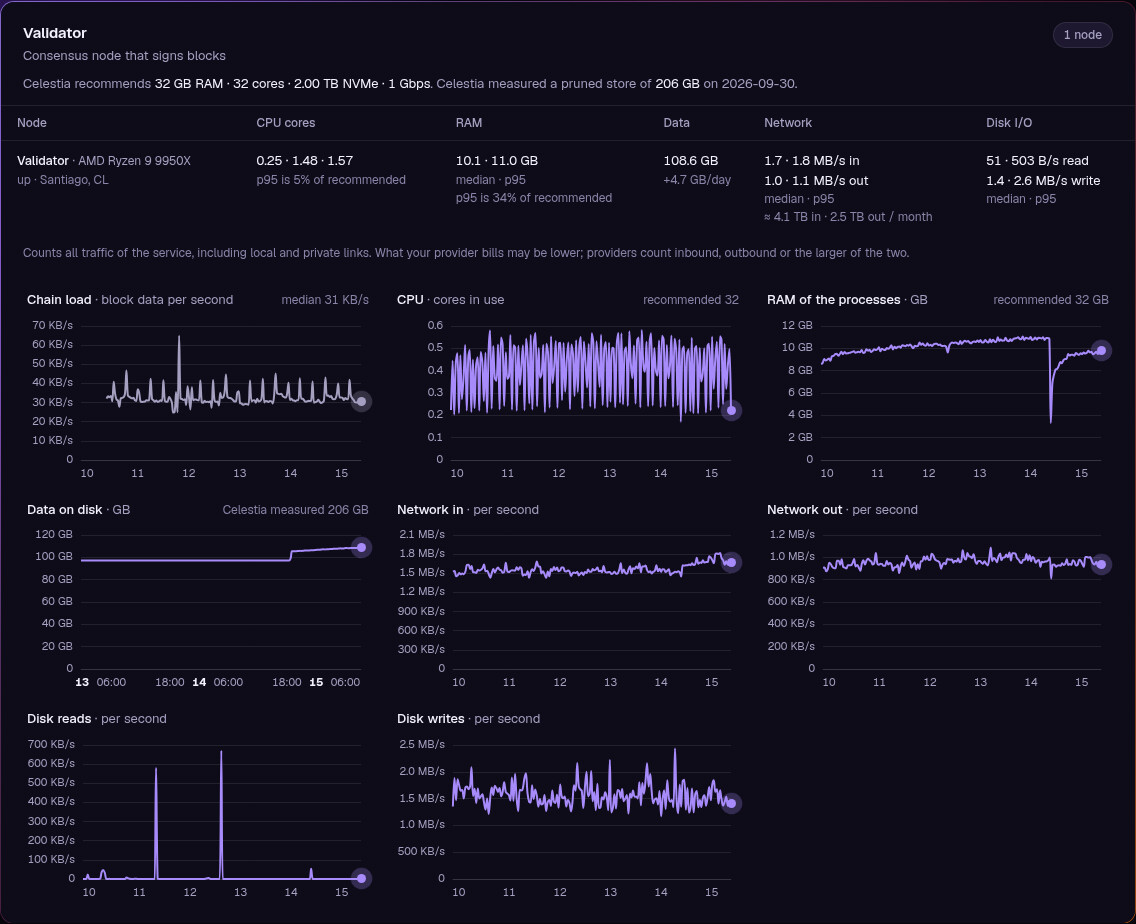
Each role has a table and a set of charts. For example, a validator on a Ryzen 9 9950X uses about 0.25 CPU cores at the median and about 1.5 at p95, roughly 5% of the recommended 32 cores, and 10-11 GB of RAM against the recommended 32 GB. Data on disk is shown with its growth per day. The network column also gives an estimate of monthly traffic in and out, which matters when a provider sells bandwidth by the terabyte.
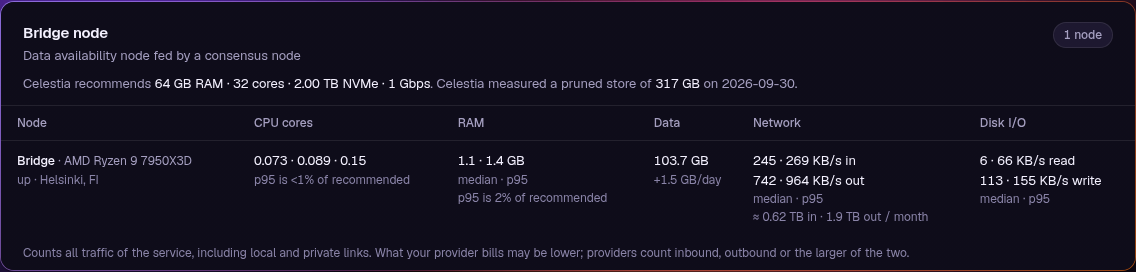
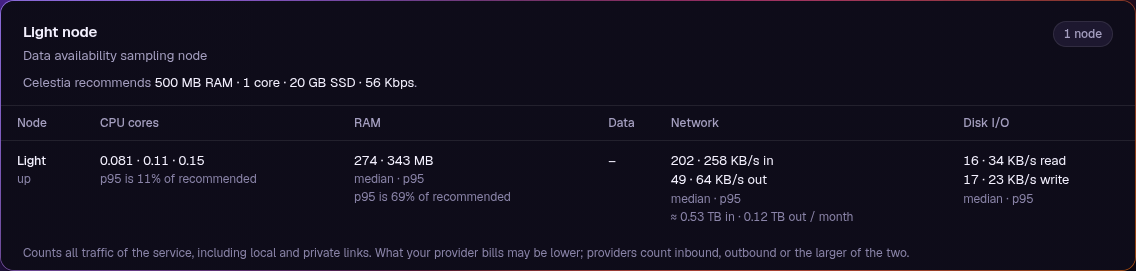
Bridge and light nodes use the same layout. Our mainnet bridge, for instance, uses about 1.1 GB of RAM against the recommended 64 GB.
Fibre, measured from the server side
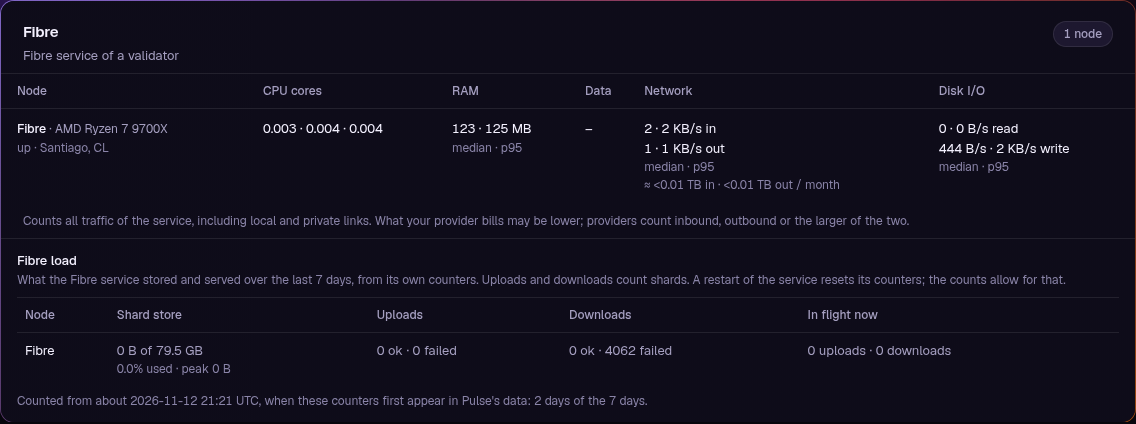
For Fibre we show the service’s own resource use plus its load, taken from Fibre’s own metrics: how much of the storage budget is used, and how many shard uploads and downloads it handled in the window. Our mainnet Fibre currently holds no data (0 B of a 79.5 GB budget), so its numbers show the idle baseline of the service. Downloads counted as failed are requests for shards the server does not hold.
A note on geography. Our Mocha Fibre server runs in Singapore. It accepts uploads and signs them, but its signature rarely ends up in the set a client submits on-chain: Valopers shows 0.9% endorsement over the last 24 hours. Valopers’ provider table shows the same pattern across the network. Servers within ~150 ms of its probe hold about 56% of stake and are included in nearly every blob, while servers 260 ms or more away (about 30% of stake) are included in about 8% of blobs on average. A client only needs signatures from 2/3 of stake, and the nearer servers fill that first. We have not verified where the uploading clients run, so take this as an observation rather than a measured cause.
Estimates, kept apart from measurements

Anything we do not measure is labelled as an estimate. The Fibre estimate uses the Foundation’s Fibre calculator for our voting power: 148 rows, 79.5 GB of storage and about 0.053 Gbps of inbound traffic at today’s parameters, as a worst case.
How we measure
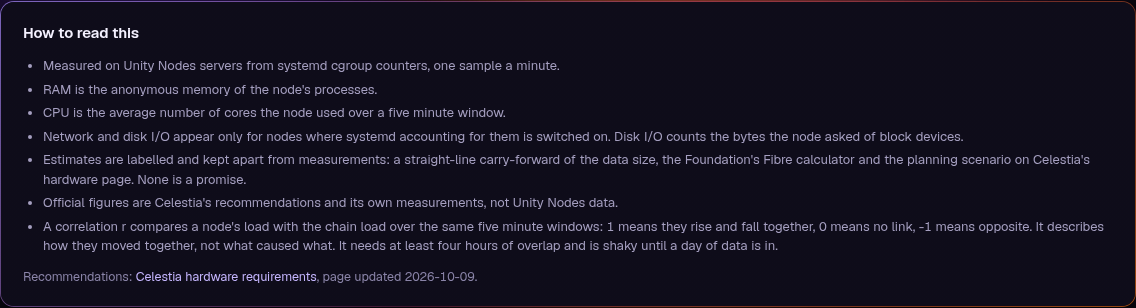
- systemd cgroup counters per service, one sample per minute, on our own servers.
- RAM is the anonymous memory of the node’s processes, without the kernel file cache.
- CPU is the average number of cores used over a five-minute window.
- Traffic counts everything the service sends and receives, including local and private links, so what a provider bills may be lower.
- One node per role, our own setup, today’s network. These are measurements, not a sizing guarantee: Celestia’s recommendations leave headroom for future throughput, so size for those.
For AI agents
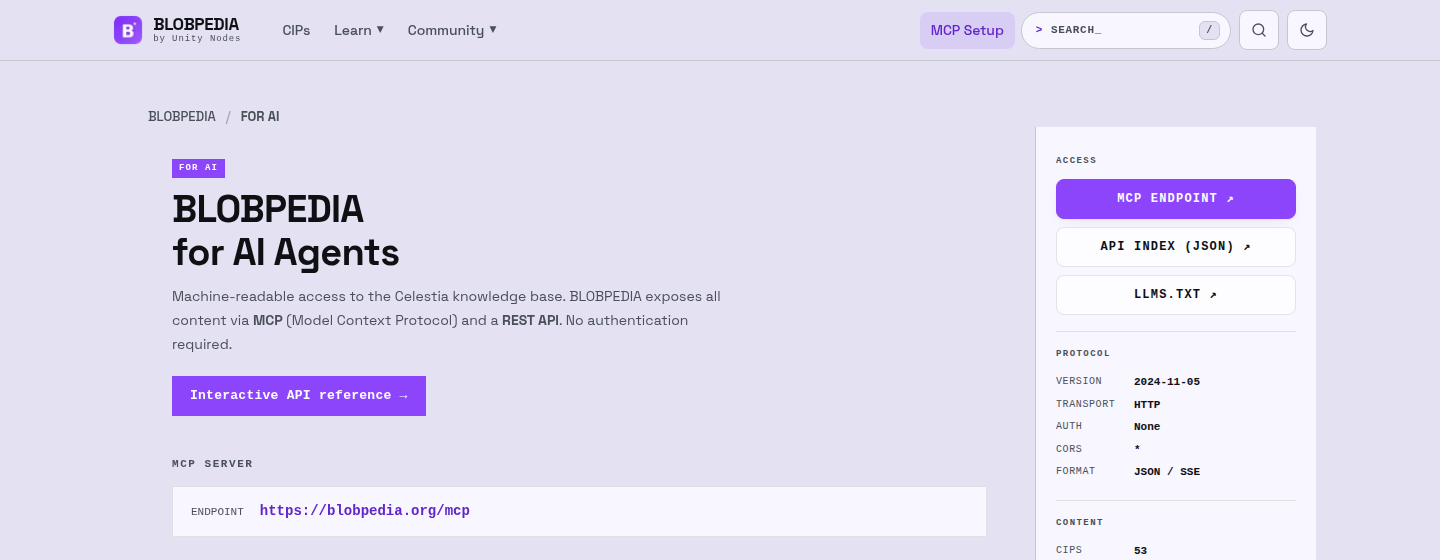
The same data is available through the Blobpedia MCP ( BLOBPEDIA for AI | MCP + REST API | BLOBPEDIA ), tool get_celestia_hardware_usage, so an agent can query it by role, network and window.